
Sensory Translations
Your body produces data all the time. Heart rate, breath, the small rhythms that never stop. Medicine reads these numbers to find what is wrong. This project reads them for something else.
Sensory Translations turns those signals into visuals. You open an HTML file on your phone, and the phone measures your heart rate through the tapping motion and your breath through the microphone. That data feeds into a Processing sketch running on a computer, and the abstract numbers become a moving image. Something you usually cannot see becomes something you can sit with.





프로젝트 사진들
Project Overview

이 프로젝트에 대한 개요
의학 데이터가 진단 이외의 무언가를 말할 수 있다고 처음 생각하게 된 계기에 대해서 설명?
언어로 감정을 표현하기 어려운 사람들을 이 프로젝트의 대상으로 정한 이유는?
HUD

A small readout sits in the corner. It shows the current heart rate, the breath moving between inhale and exhale, whether the data is live or simulated, and a row of dots marking each color the piece has moved through. A marker flashes on every beat.
Smoothing the Signals

Raw data jumps around. Instead of letting the image jerk with every reading, I ease each new value toward the incoming number a little at a time. The heart rate and breath shift smoothly, so the motion stays calm even when the data is noisy.
Inside the Code: Visualizer

Mode B: Radial Pulse

The second mode waits for each heartbeat, then spawns a burst of particles from the center of the screen. A faster heart rate spawns more particles, and breath sets how far they travel. Each particle curves slightly as it flies, so the burst blooms instead of shooting straight out. The particles fade as they go, leaving a pulse that beats in time with your heart.
The sketch runs a WebSocket server that listens on a local port. Your phone connects to it and sends your heart rate and breath as small messages. I wrote a parser that pulls the two numbers out of each message. If the phone goes quiet for three seconds, the sketch notices and switches over on its own.
The Simulation Fallback

When no phone is connected, the piece generates its own heart rate and breath using noise and sine waves. This keeps the visual alive during setup, testing, or exhibition downtime, and the simulated body still rises and falls like a real one.
Mode A: Flow Field
The first mode holds 1,200 particles. Each one reads a noise field to find its direction, then drifts along it and leaves a faint mark behind. Your breath controls how hard the particles push, and your heart rate sets how fast the field shifts. When a particle dies or leaves the screen, it respawns near the center. The marks build up into tangled threads of color.
Receiving the Data


The first mode renders the signals as a dense field of flowing lines. Thousands of fine particles drift across the screen following a noise-driven flow field, layering into soft, tangled threads of color. Greens, blues, and yellows blend and overlap, so the whole canvas reads like smoke or currents moving through dark water. Your breath drives the motion, and the lines build up and fill the space as the data comes in
Visualizer Renders
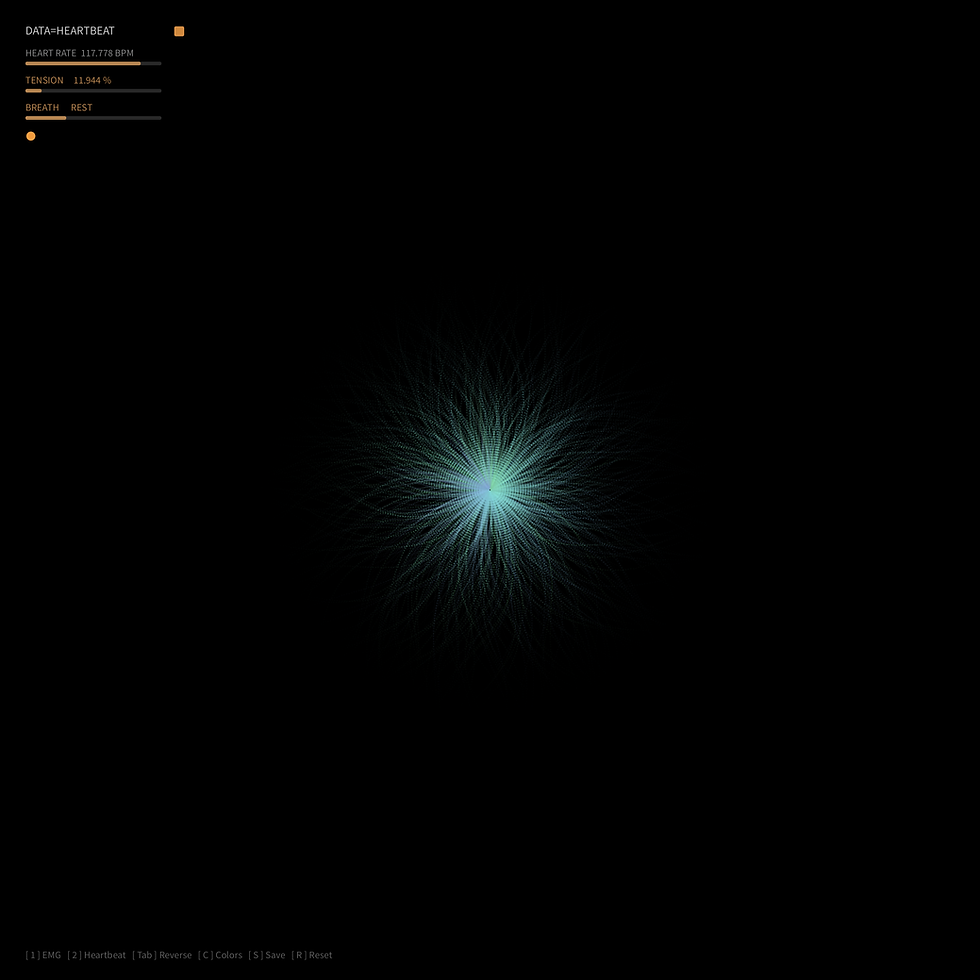
The second mode visualizes heart rate as a burst of light at the center of the screen. Particles radiate outward from a single point, forming a bloom that pulses with each beat. A faster heart rate pushes the pulse harder and brighter, and the color shifts as the rate changes. The form expands and contracts in time with your heartbeat, so you watch the pulse instead of just reading the number.

Both modes run from the same incoming data. You can You switch between them, reverse the motion, change the color palette, and save any frame as a still image.








Bio Data
DATA 01
Heart Rate
I custom-coded an HTML file that runs on your phone. You tap the screen in time with your own heartbeat, and the file records your heart rate based on how fast you tap. The tapping speed translates into beats per minute, which feed directly into the visual.

DATA 02
Breath
The phone microphone reads your breathing. Breathe near the mic, and it picks up the rise and fall of each inhale and exhale. The rhythm of your breath shapes how the visual moves and shifts in real time.

Bio Data
DATA 01
Heart Rate
I custom-coded an HTML file that runs on your phone. You tap the screen in time with your own heartbeat, and the file records your heart rate based on how fast you tap. The tapping speed translates into beats per minute, which feed directly into the visual.
리아가 스마트폰으로 컨트롤 하는 사진
DATA 02
Breath
The phone microphone reads your breathing. Breathe near the mic, and it picks up the rise and fall of each inhale and exhale. The rhythm of your breath shapes how the visual moves and shifts in real time.
리아가 스마트폰으로 컨트롤 하는 사진